Early insight into new medicine launches in Canadian and international markets
PDF - 765 KB
New medicines represent an increasingly important segment of the global pharmaceutical market. Over the last two years, a greater than average number of new medicines were approved, the majority of which were high-cost specialty therapies. While some of these medicines may play a key role in addressing unmet needs or offer significant therapeutic benefit to patients, rising numbers of new high-cost treatments have placed increasing pressure on payers in Canada and internationally.
This analysis explores the market dynamics of new medicines that received first-time market approval through the US Food and Drug Administration (FDA), the European Medicines Agency (EMA), and/or Health Canada in 2017, and analyzes their uptake, pricing, sales, and availability as of the last quarter of 2018 (Q4-2018). It also provides a preliminary examination of new medicines approved in 2018, as well as trends in the new medicine market since 2009. These results will be published in the upcoming edition of the PMPRB’s Meds Entry Watch report.
International markets examined include the seven countries the PMPRB considers in reviewing the prices of patented medicines (PMPRB7): France, Germany, Italy, Sweden, Switzerland, the United Kingdom (UK), and the United States (US); as well as other countries in the Organisation for Economic Co-operation and Development (OECD).
1. A greater number of medicines were approved in 2017 and 2018, as the share of specialty therapies continued to rise
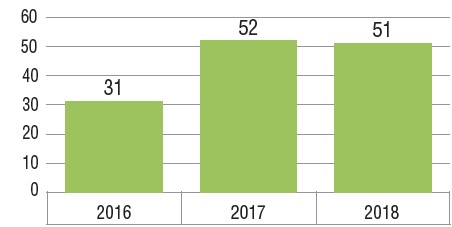
Fifty-two new medicines received first-time approval through the FDA, the EMA, and/or Health Canada in 2017 and 51 were approved in 2018. This follows a total of 31 approvals in 2016 and represents a steep rise from the annual average of 36 between 2009 and 2016.
Three quarters of the market entrants in 2017 were orphan, biologic, or oncology medicines. Over the past three years, an increasingly significant proportion of new therapies have had an orphan designation from the FDA or EMA, including more than half of all new medicines in 2018. Many orphan therapies are used to treat cancer, contributing to the near one-third share of oncology treatments among new medicines. While biologics make up a smaller portion of the growing market, the number of new biologic medicines approved continues to be significant. There is notable overlap among these designations, as illustrated in the Venn diagram below, which means that a single medicine may be counted in multiple specialty categories.
New medicines approved in Canada and the PMPRB7*, 2016 to 2018
| |
2016 |
2017 |
2018 |
| Orphan medicines |
13 (42%) |
23 (44%) |
30 (60%) |
| Oncology medicines |
5 (16%) |
17 (33%) |
15 (29%) |
| Biologic medicines |
13 (42%) |
18 (35%) |
14 (27%) |
| Total specialty medicines |
20 (65%) |
39 (75%) |
37 (73%) |
Figure description
This bar graph depicts the number of new medicines launched in Canada and the PMPRB7 from 2016 to 2018. A table shows the number and share of orphan, oncology, and biologic medicines for each annual total.
| |
2016 |
2017 |
2018 |
| Total number of new medicines |
31 |
52 |
51 |
| Number of orphan medicines |
13 |
23 |
30 |
| Share of orphan medicines |
42% |
44% |
60% |
| Number of oncology medicines |
5 |
17 |
15 |
| Share of oncology medicines |
16% |
33% |
29% |
| Number of biologic medicines |
13 |
18 |
14 |
| Share of biologic medicines |
42% |
35% |
27% |
| Total number of specialty medicines |
20 |
39 |
37 |
| Total share of specialty medicines |
65% |
75% |
73% |
Distribution of 2017 new medicines by orphan, cancer, and biologic designation
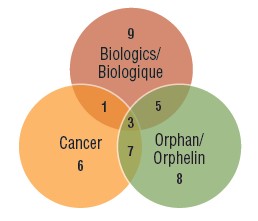
Figure description
A Venn diagram illustrates the overlap between orphan, biologic, and oncology medicines among the 2017 new medicines: nine medicines were biologic, eight had an orphan designation, and six were cancer medicines. Five were both biologic and orphan, one was both biologic and oncological, seven were both orphan and oncological, and three were biologic cancer medicines that also received an orphan designation.
2. Medicines approved between 2009 and 2017 accounted for approximately one third of total pharmaceutical sales by Q4-2018
The year-over-year increase in the new medicine share of the total pharmaceutical market depends on the number and therapeutic relevance of the medicines approved. For example, between 2014 and 2016, the new medicine share of sales increased sharply by 13.5% as a result of the introduction of the direct-acting antiviral (DAA) drugs for hepatitis C. From 2016 to 2018, the uptake of new medicines slowed to a more modest 6.1%, with 2016 and 2017 approvals accounting for 2.3% and 2.8% of all new medicine sales by Q4-2018, respectively.
Cumulative new medicine share of all brand-name medicine sales by year of first approval (2009 to 2017), Canada and the PMPRB7
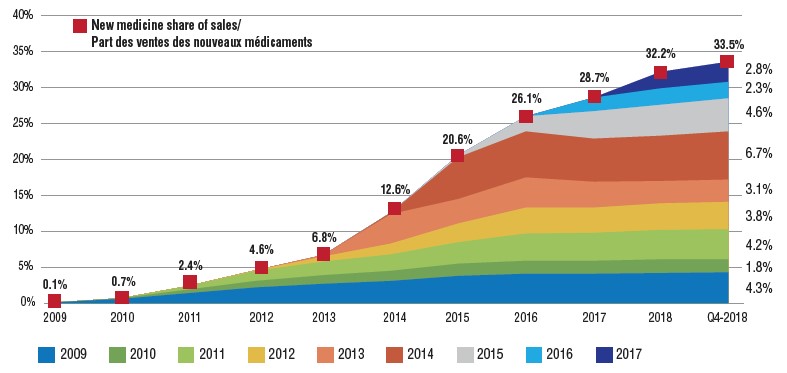
Figure description
This is an area graph depicting the new medicine cumulative share of total brand-name medicine sales by launch year for Canada and the seven PMPRB comparator countries. It tracks the percentage of new medicine launches in annual sales up to the fourth quarter of 2018. The total new medicine share of sales for each year is also marked.
| Launch year |
2009 |
2010 |
2011 |
2012 |
2013 |
2014 |
2015 |
2016 |
2017 |
2018 |
Q4-2018 |
| 2009 |
0.1% |
0.6% |
1.4% |
2.2% |
2.7% |
3.1% |
3.8% |
4.1% |
4.1% |
4.2% |
4.3% |
| 2010 |
|
0.1% |
0.5% |
0.9% |
1.2% |
1.4% |
1.7% |
1.8% |
1.8% |
1.9% |
1.8% |
| 2011 |
|
|
0.5% |
1.4% |
1.9% |
2.3% |
3.0% |
3.8% |
3.9% |
4.1% |
4.2% |
| 2012 |
|
|
|
0.1% |
0.7% |
1.5% |
2.6% |
3.6% |
3.5% |
3.7% |
3.8% |
| 2013 |
|
|
|
|
0.2% |
4.1% |
3.4% |
4.2% |
3.6% |
3.1% |
3.1% |
| 2014 |
|
|
|
|
|
0.2% |
5.8% |
6.4% |
6.0% |
6.3% |
6.7% |
| 2015 |
|
|
|
|
|
|
0.3% |
2.1% |
3.8% |
4.3% |
4.6% |
| 2016 |
|
|
|
|
|
|
|
|
1.9% |
2.3% |
2.3% |
| 2017 |
|
|
|
|
|
|
|
|
|
2.3% |
2.8% |
| New medicine share of sales |
0.1% |
0.7% |
2.4% |
4.6% |
6.8% |
12.6% |
20.6% |
26.1% |
28.7% |
32.2% |
33.5% |
3. Over half of the 2017 medicines had approval in Canada by Q4-2018, and more than a third had sales, including most of the international top-selling new therapies
Out of the 52 medicines first approved in 2017 by either the FDA, EMA, or Health Canada, 13 (25%) were approved in Canada by Q4-2017, compared to 49 (94%) in the US, and 19 (37%) by the EMA in Europe. By Q4-2018, 28 (54%) of the 2017 new medicines were approved in Canada and 34 (65%) in Europe, substantially narrowing this gap.
Of those approved in Canada, 18 (35%) had sales by the end of 2018, placing Canada sixth among the OECD countries and in line with the PMPRB7. By comparison, Canada ranked last among the PMPRB7 and 11th in the OECD for the sales of 2016 medicines in Q4-2017. The corresponding share of sales for the 2017 new medicines sold domestically remained among the highest in the OECD at approximately 88%, suggesting that the higher selling medicines were approved in Canada.
Number of 2017 new medicines with market approval, Q4-2017 and Q4-2018
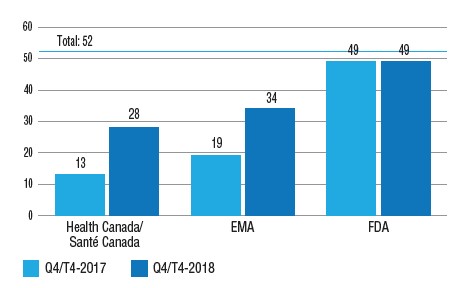
Figure description
This is a bar graph with the number of 2017 new medicines approved by Health Canada, the European Medicines Agency, and the Food and Drug Administration in the United States as of the fourth quarter of 2017 and as of the fourth quarter of 2018. The total number of new medicines in 2017 was 52.
| |
Health Canada |
European Medicines Agency |
US Food and Drug Administration |
| Q4-2017 |
13 |
19 |
49 |
| Q4-2018 |
28 |
34 |
49 |
Share of new medicines approved in Canada and the PMPRB7 in 2017 with sales, and their respective share of OECD sales, by country, Q4-2018
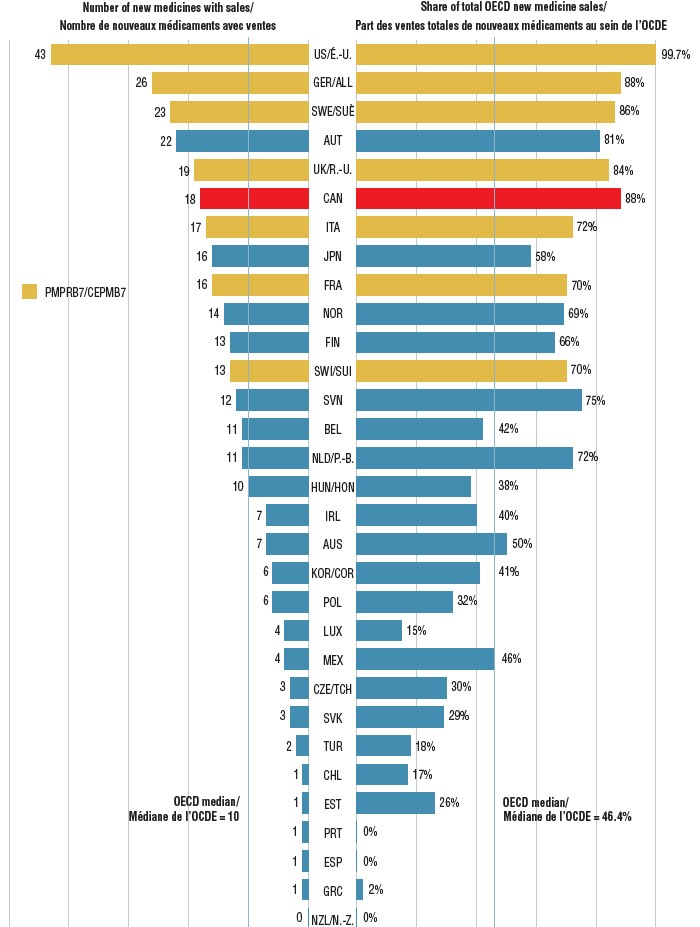
Figure description
This is a split bar graph showing the number of new medicines approved and with available sales as of the fourth quarter of 2018 and the corresponding share of 2018 fourth quarter sales in 31 Organisation for Economic Co-operation and Development countries. A median is given for each side of the graph.
| Country |
Number of new medicines with sales |
Share of total Organisation for Economic Co-operation and Development sales |
| United States |
43 |
99.7% |
| Germany |
26 |
88% |
| Sweden |
23 |
86% |
| Austria |
22 |
81% |
| United Kingdom |
19 |
84% |
| Canada |
18 |
88% |
| Italy |
17 |
72% |
| Japan |
16 |
58% |
| France |
16 |
70% |
| Norway |
14 |
69% |
| Finland |
13 |
66% |
| Switzerland |
13 |
70% |
| Slovenia |
12 |
75% |
| Belgium |
11 |
42% |
| Netherlands |
11 |
72% |
| Hungary |
10 |
38% |
| Ireland |
7 |
40% |
| Australia |
7 |
50% |
| South Korea |
6 |
41% |
| Poland |
6 |
32% |
| Luxembourg |
4 |
15% |
| Mexico |
4 |
46% |
| Czech Republic |
3 |
30% |
| Slovakia |
3 |
29% |
| Turkey |
2 |
18% |
| Chile |
1 |
17% |
| Estonia |
1 |
26% |
| Portugal |
1 |
0% |
| Spain |
1 |
0% |
| Greece |
1 |
2% |
| New Zealand |
0 |
0% |
| OECD median |
10 |
46.4% |
4. Over two thirds of the 2017 new medicines came with high treatment costs
Fourteen of the oncology medicines approved in 2017 had costs exceeding $5,000 for a 28-day treatment regimen, and 20 non-oncology medicines had costs exceeding $10,000 annually. These high-cost medicines accounted for 68% of the 2017 new approvals with reported sales in Canada and the PMPRB7 by Q4-2018.
Of the medicines with available Canadian sales, 14 (28%) were expensive drugs for rare diseases (EDRDs): five non-oncology orphan medicines with annual treatment costs in excess of $100,000 and nine orphan medicines for cancer with 28-day treatment costs over $7,500. All 14 medicines received their orphan designations through the FDA. Of the five non-oncology EDRDs, three are indicated to treat central nervous system diseases, four are biologic medicines, and one is a gene therapy.
Number of new high-cost medicines approved in 2017, Q4-2018 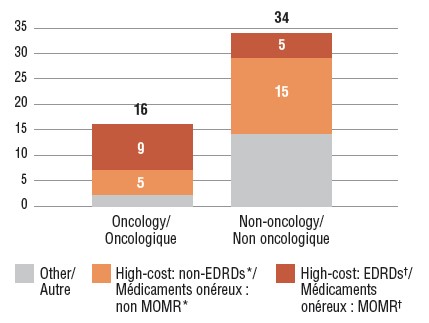
Figure description
This stacked bar graph gives the distribution of 2017 new medicines with available sales by treatment cost. The first bar shows the distribution of new oncology medicines, while the second gives the totals for non-oncology medicines. Each bar is broken down into the number of new medicines that are expensive drugs for rare diseases (EDRDs), those that are high-cost but do not qualify as EDRDs, and all other non-high-cost medicines. High-cost medicines exceed $10,000 in annual treatment costs for non-oncology medicines or $5,000 per 28-day cycle for oncology medicines. Expensive drugs for rare diseases are defined as having treatment costs in excess of $100,000 annually for non-oncology or $7,500 per 28-day cycle for oncology medicines, as well as an orphan designation from either the US Food and Drug Administration or the European Medicines Agency.
| |
Expensive drugs for rare diseases† |
High-cost medicines*, other than EDRDs |
Other |
Total |
| Oncology medicines |
9 |
5 |
2 |
16 |
| Non-oncology medicines |
5 |
15 |
14 |
34 |
* High-cost medicines have treatment costs exceeding $5,000 per 28-day cycle for oncology or $10,000 annually for non-oncology.
† Expensive drugs for rare diseases (EDRDs) have an orphan designation through the FDA or EMA and treatment costs exceeding $7,500 per 28-day cycle for oncology medicines or $100,000 annually for non-oncology.
Expensive drugs for rare diseases (EDRDs) approved in 2017 with sales, and their treatment costs, Q4-2018
| Therapeutic class* |
Medicine (trade name, form, strength, volume)† |
Treatment cost‡ |
| Treatment cost (CAD) |
Annual/Course |
| A16 – Other alimentary tract and metabolism products |
Vestronidase alfa (Mepsevii, infus. vial/bottle, 2 mg/ml, 5 ml)B,O |
$683,900 |
Annual (25 kg) |
| B02 – Antihemorrhagics |
Emicizumab (Hemlibra, vial sc, 150 mg/ml, 1 ml)B,O |
$732,753 / $680,413 |
First year / subsequent years |
| L1 – Antinoeplastics |
Tisagenlecleucel (Kymriah, infus. bags)B,C,G,O |
$482,550 |
One-time treatment |
| L1 – Antinoeplastics |
Avelumab (Bavencio, infus. vial/bottle, 20 mg/ml, 10 ml)B,C,O |
$9,738 |
28-days |
| L1 – Antinoeplastics |
Inotuzumab ozogamicin (Besponsa, infus. dry bottle, 0.9-1 mg) B,C,O |
$48,490 / $40,375 |
21 days / subsequent 28 days |
| L1 – Antinoeplastics |
Brigatinib (Alunbrig, film-ctd tabs, 180 mg) C,O |
$9,435 |
28 days |
| L1 – Antinoeplastics |
Copanlisib (Aliqopa, inf. dry bottle, 60 mg) C,O |
$16,200 |
28 days |
| L1 – Antinoeplastics |
Midostaurin (Rydapt, capsules, 25 mg) C,O |
$9,270 |
28 days |
| L1 – Antinoeplastics |
Enasidenib (Idhifa, film-ctd tab, 100 mg) C,O |
$27,227 |
28 days |
| L1 – Antinoeplastics |
Niraparib (Zejula, capsules, 100 mg) C,O |
$13,300 |
28 days |
| N7 – Other CNS drugs |
Deutetrabenazine (Austedo, ctd tab, 12 mg)O |
$19,760 / $158,100 |
Annual |
| N7 – Other CNS drugs |
Edaravone (Radicava, infus. bag, 300 Y/ml, 100 ml)O |
$190,880 / $185,182 |
First year / subsequent years |
| N7 – Other CNS drugs |
Cerliponase alfa (Brineura, infus. vial/bottle, 30 mg/ml, 5 ml)B,O |
$841,900 |
Annual |
| V3C – Radiopharmaceuticals |
Lutetium Lu 177 dotatate (Lutathera, infus. vial/bottle, 370 mg/ml, 30 ml)C,O |
$140,000 |
32 weeks |
* Level 2 of the Anatomical Classification of Pharmaceutical Products, as reported in MIDAS.
† B: biologic; C: cancer; O: orphan medicines; G: gene therapies.
‡ Treatment costs were calculated using sales data from the IQVIA MIDAS® Database as of Q4-2018. Information on dosing regimens was taken from the product monograph provided by Health Canada, the FDA or EMA if unavailable through Health Canada, or from reports issued by the Canadian Agency for Drugs and Technologies in Health (CADTH).
5. The majority of 2017 new medicines assessed by CADTH received reimbursement recommendations conditional on price
Of the 52 new medicines approved in 2017, 22 were reviewed by the Canadian Agency for Drugs and Technologies in Health (CADTH) through their Common Drug Review (CDR) and pan-Canadian Oncology Drug Review (pCODR) processes as of Q4-2018. Seventeen of the reviewed medicines were given a recommendation to reimburse on the condition that their cost-effectiveness be improved to an acceptable level. Four of the remaining medicines received a recommendation not to reimburse, due to a lack of evidence of clinical benefit.
Summary of Common Drug Review and pan-Canadian Oncology Drug Review assessments for 2017 new medicines approved in Canada by Q4-2018
| Medicine (trade name) |
Treatment cost* (CAD) |
Annual/Course |
Recommendation |
| Ozenoxacin (Ozanex) |
<$20K |
5 days |
Do not reimburse |
| Ertugliflozin (Steglatro) |
<$20K |
Annual |
Do not reimburse |
| Semaglutide (Ozempic) |
<$20K |
Annual |
Reimburse conditional on price |
| Ribociclib (Kisqali) |
<$20K |
28 days |
Reimburse conditional on price |
| Midostaurin (Rydapt) |
<$20K |
28 days |
Reimburse |
| Brigatinib (Alunbrig) |
<$20K |
28 days |
Do not reimburse |
| Avelumab (Bavencio) |
<$20K |
28 days |
Reimburse conditional on price |
| Durvalumab (Imfinzi) |
<$20K |
28 days |
Reimburse conditional on price |
| Brodalumab (Siliq) |
<$20K |
Annual |
Reimburse conditional on price |
| Guselkumab (Tremfya) |
$20K-$40K |
Annual |
Reimburse conditional on price |
| Letermovir (Prevymis) |
$20K-$40K |
100 days |
Reimburse conditional on price |
| Dupilumab (Dupixent) |
$20K-$40K |
Annual |
Do not reimburse |
| Benralizumab (Fasenra) |
$20K-$40K |
Annual |
Reimburse conditional on price |
| Ocrelizumab (Ocrevus) |
$20K-$40K |
Annual |
Reimburse conditional on price |
| Inotuzumab (Besponsa) |
$40K-$60K |
28 days |
Reimburse conditional on price |
| Sarilumab (Kevzara) |
$40K-$60K |
Annual |
Reimburse conditional on price |
| Voxilaprevir (Vosevi) |
$40K-$60K |
12 weeks |
Reimburse conditional on price |
| Glecaprevir (Mavyret) |
$60K-$80K |
16 weeks |
Reimburse conditional on price |
| Lutetium Lu 177 dotatate (Lutathera) |
>$100K |
32 weeks |
Reimburse conditional on price |
| Edaravone (Radicava) |
>$100K |
Annual |
Reimburse conditional on price |
| Tisagenlecleucel (Kymriah) |
>$100K |
One-time treatment |
Reimburse conditional on price |
| Cerliponase alfa (Brineura) |
>$100K |
Annual |
Reimburse conditional on price |
* Treatment costs were calculated using sales data from the IQVIA MIDAS® Database as of Q4-2018. Information on dosing regimens was taken from the product monograph provided by Health Canada, the FDA or EMA if unavailable through Health Canada, or from reports issued by the Canadian Agency for Drugs and Technologies in Health (CADTH).
Data source: IQVIA MIDAS® Database (all rights reserved), 2009 to 2018.
Limitations: Canadian and international sales and list prices available in the IQVIA MIDAS® Database are estimated manufacturer factory-gate list prices and do not reflect off-invoice price rebates and allowances, managed entry agreements, or patient access schemes.
Disclaimer: Although this information is based in part on data obtained under license from IQVIA’s MIDAS® Database, the statements, findings, conclusions, views, and opinions expressed in this study are exclusively those of the PMPRB and are not attributable to IQVIA.